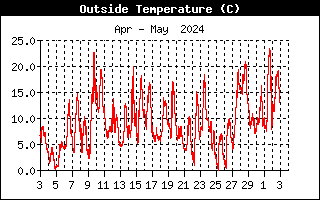
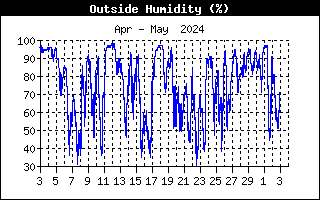
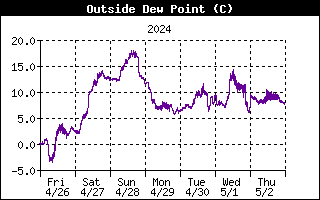
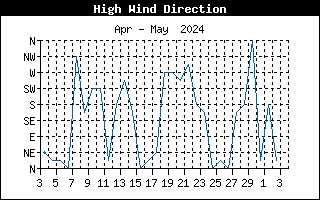
Weather Observed At 43-11-01 N 79-33-34 W |
2024-04-19
| Yesterday's Extremes : | Max | Min |
||
| Temperature |
17.1 °C |
at 1:46pm |
6.0 °C |
at 8:16am |
| Relative Humidity |
96 % |
at 10:17am |
51 % |
at 5:32pm |
| Dew Point |
13.3 °C |
at 11:52am |
-0.6 °C |
at 11:50pm |
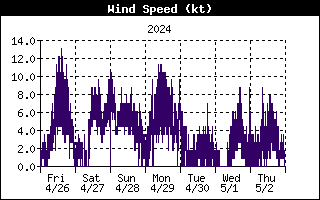
| Wind |
20.9 kt |
at 12:47pm |
||
| Pressure |
30.012 " |
at 12:00am |
29.760 " |
at 9:40am |
| Rainfall Rate | 2.2 mm/h | at 9:54am | ||
| Snow On Ground |
|
|||
| Brightness/Darkness |
1041 W/m² |
at 1:31pm |
| at
|
| Precipitation | Yesterday | Storm Total |
| Rainfall | 1.6 mm
|
1.6 mm |
| Snowfall |
0.0 cm | 0.0 cm |
| Evapotranspiration | -2.18 mm |
| This Month's Extremes : | Max |
Min |
| Temperature |
22.8 °C |
0.0 °C |
| Relative Humidity |
98 % |
31 % |
| Dew Point |
13.9 °C |
-5.6 °C |
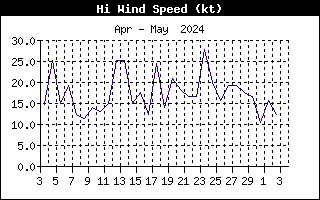
| Wind |
25.2 kt |
|
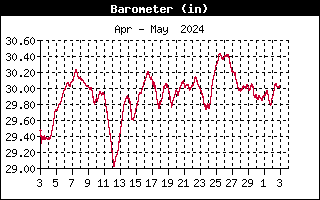
| Pressure |
30.230 " |
29.024 " |
| Rainfall Rate | 90.0 mm/h | |
| Snow on Ground |
Trace |
|
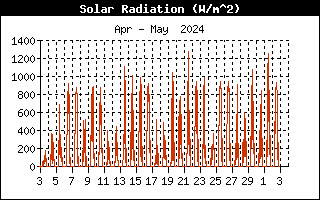
| Solar Radiation |
1111 W/m² |
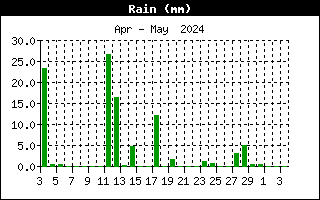
| Monthly Rainfall |
90.6 mm |
| Monthly Snowfall | 0.4 cm |
| Monthly Total Precipitation | 91.2 mm |
| Monthly Evapotranspiration | -39.52 mm |
| CLIMAT Data | |||||||||
| Official | Yesterday |
Normals & Records | |||||||
| 2020 | 2021 | 2022 | 2023 | 2024 | |||||
| 2010 | 2011 | 2012 | 2013 | 2014 | 2015 | 2016 | 2017 | 2018 | 2019 |
| 2004 | 2005 | 2006 | 2007 | 2008 | 2009 | ||||
